
S-Curves Psychological Research and Statistics

 Students in many fields learn that relationships between variables may be described as a simple one-to-one correspondence or linear. We often see tables of correlations in journal articles and presentations. Unless otherwise stated, the correlations appear to assume a linear relationship exists. As one variable increases so does the other or as one variable increases, the other declines.

But we also learn that some relationships are nonlinear such as the forgetting curve (remember Ebbinghaus) or the learning curve depicted as an S-shape.

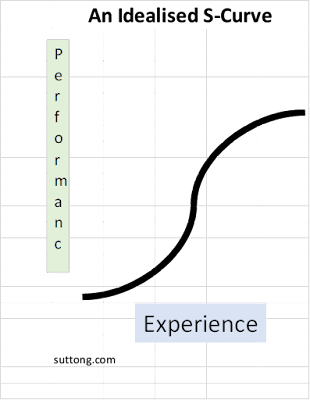
The classic learning curve illustrates the relationship between learning and experience and is often presented as an S-curve. At first, progress is slow—the curve of learning rises a little. Then, with experience, learning rises rapidly up to a point when it seems to level off at a person’s level of proficiency. This curve has many names such as progress curve, startup curve, and experience curve.

However, we should follow the data rather than assume a learning curve is applicable. Perhaps there is no relationship or another curve is a better fit.


A curve I drew in Excel

Reference for using scales in research:

Buy Creating Surveys on

GOOGLE BOOKS


AMAZON


Reference for clinicians on understanding assessment

Buy Applied Statistics for Counselors


GOOGLE BOOKS


AMAZON


MORE RESOURCES


NOTICE:

The information about scales and measures is provided for clinicians and researchers based on professional publications. The links to authors, materials, and references can change. You may be able to locate details by contacting the main author of the original article or another author on the article list.

 Post Author


Geoffrey W. Sutton PhD is Emeritus Professor of Psychology who publishes book and articles about clinical and social psychology including the psychology of religion. Website:     www.suttong.com


Books available on   AMAZON       and the   GOOGLE STORE


Connections

   FACEBOOK   Geoff W. Sutton  


   TWITTER  @Geoff.W.Sutton


   PINTEREST  www.pinterest.com/GeoffWSutton


Read many published articles and book samples on:


  Academia   Geoff W Sutton   


  ResearchGate   Geoffrey W Sutton 


Comments

Popular posts from this blog

Personal Self-Concept Questionnaire (PSQ)

  The Personal Self-Concept Questionnaire  ( PSQ )   Overview The Personal Self-Concept Questionnaire (PSQ) measures self-concept based on ratings of 18 items, which are grouped into four categories: Self-fulfilment, autonomy, honesty, and emotional self-concept. It is a likert-type rating scale with high internal consistency values and has been used with youth and adults. Subscales : The PSQ has four subscales 1. Self-fulfilment (6 items) 2. Autonomy (4 items) 3. Honesty (3 items) 4. Emotional self-concept (5 items)  ðŸ‘‰ [ Read more about Self-Concept and Self-Identity] The PSQ is a Likert-type scale with five response options ranging from totally disagree to totally agree. Reliability and Validity In the first study, coefficient alpha = .85 and in study two, alpha = .83. Data analysis supported a four-dimensional model (see the four categories above). Positive correlations with other self-concept measures were statistically significant. Other notes The authors e...

Mathematics Self-Efficacy and Anxiety Questionnaire (MSEAQ)

  Scale name: Mathematics Self-Efficacy and Anxiety Questionnaire (MSEAQ) Scale overview: The Mathematics Self-Efficacy and Anxiety Questionnaire (MSEAQ) is a 29-item self-report measure of both mathematics self-efficacy and mathematics anxiety. Author: Diana Kathleen May Response Type: Items are rated on a 5-point Likert-type scale following a “no response” option: 1 = Never 2 = Seldom 3 = Sometimes 4 = Often 5 = usually Sample items 1. I feel confident enough to ask questions  in my mathematics class. 6. I worry that I will not be able to get a  good grade in my mathematics course.   Subscales and basic statistics for the MSEAQ       Self-Efficacy M = 44.11, SD = 10.78, alpha = .93       Anxiety M = 46.47, SD = 12.61, alpha = .93       Total Scale M = 90.58, SD = 22.78, alpha = .96 Reliability: See the Cronbach’s alpha levels reported above. Validity: There were significant ...

Academic Self-Efficacy Scale ASE

  Overview The  Academic Self-Efficacy Scale is an application of Self-Efficacy Theory   to examine the relationship between self-efficacy and academic performance using 8-items rated on a 7-point scale. The work of Chemers et al. (2001) has been widely cited. Format The 8-items are rated on a 7-point Likert-type scale ranging from 1 = Very Untrue to 7 = Very True. Sample Items 2. I know how to take notes. 6. I usually do very well in school and at academic tasks.   Reliability, Validity, and Other Research notes In the article describing the development and use of the ASE, the authors observed: “As predicted, academic self-efficacy was significantly and directly related to academic expectations and academic performance.” (Chemers et al., 2001, p. 61)   Sutton et al. (2011) reported Cronbach's alpha of .83 in their study of academic self-esteem and personal strengths. ASE was highly positively correlated with ACT scores (.24) and GPA (.39)....