
Worldview Assessment- An Example


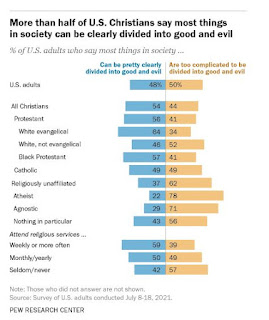
Graphic from Pewresearch 2021

Pew Researchers have a great deal of experience in asking people questions. Formulating a good question for a survey is an important place to begin.

However, another lesson from Pew is the additional data they gather. I noticed a large graphic illustrating how people in different groups answered one question. When conducting survey research it is critical to consider what we need to know about the people responding to a question or item to understand the meaning of their response.

Consider Pew's survey item with two choices: "most things in society...

     Can be pretty clearly divided into good and evil

     Are too complicated to be divided into good and evil

The graphic shows how different groups responded and allows for comparisons on the two ways to respond.

Later, in the article, they compare political affiliations, which in the US means Republican and Democrat. This is worth studying as well.

The article is worth reading to learn more about framing a survey question, creating a meaningful graphic, and summarizing results for an educated public. Link PEWRESEARCH 2021

Reference

Ausubel, J. (2021, Dec 21). Christians, religiously unaffiliated differ on whether most things in society can be divided into good, evil. Retrieved from www.pewresearch.org

ad 
Learn more about creating and reporting surveys in

Buy Creating Surveys on

GOOGLE BOOKS


AMAZON


Please check out my website   www.suttong.com

   and see my books on   AMAZON       or  GOOGLE STORE

Also, consider connecting with me on    FACEBOOK   Geoff W. Sutton    

   TWITTER  @Geoff.W.Sutton    

You can read many published articles at no charge:

  Academia   Geoff W Sutton     ResearchGate   Geoffrey W Sutton 


Comments

Popular posts from this blog

Personal Self-Concept Questionnaire (PSQ)

  The Personal Self-Concept Questionnaire  ( PSQ )   Overview The Personal Self-Concept Questionnaire (PSQ) measures self-concept based on ratings of 18 items, which are grouped into four categories: Self-fulfilment, autonomy, honesty, and emotional self-concept. Subscales : The PSQ has four subscales 1. Self-fulfilment (6 items) 2. Autonomy (4 items) 3. Honesty (3 items) 4. Emotional self-concept (5 items)  ðŸ‘‰ [ Read more about Self-Concept and Self-Identity] The PSQ is a Likert-type scale with five response options ranging from totally disagree to totally agree. Reliability and Validity In the first study, coefficient alpha = .85 and in study two, alpha = .83. Data analysis supported a four-dimensional model (see the four categories above). Positive correlations with other self-concept measures were statistically significant. Other notes The authors estimated it took about 10 minutes to complete the PSQ. Their first study included people ages 12 to 36 ( n = 506). In the second s

Student Self-Efficacy

  Assessment name:  STUDENT SELF-EFFICACY SCALE * Note. This post has been updated to provide an available measure of student self-efficacy. ———- Scale overview:  The  student self-efficacy scale i s a 10-item measure of self-efficacy. It was developed using data from university nursing students in the United States. Authors: Melodie Rowbotham and Gerdamarie Schmitz Response Type:  A four-choice rating scale as follows: 1 = not at all true 2 = hardly true 3 = moderately true 4 = exactly true   Self-efficacy is the perception that a person can act in a way to achieve a desired goal.  Scale items There are 10 items. Examples: I am confident in my ability to learn, even if I am having a bad day. If I try hard enough, I can obtain the academic goals I desire.   Psychometric properties The authors reported that their sample scores ranged from 25 to 40 with a scale mean of 34.23 ( SD  = 3.80. Internal consistency was high at alpha = .84. The authors reported the results of a principal compon

Mathematics Self-Efficacy and Anxiety Questionnaire (MSEAQ)

  Scale name: Mathematics Self-Efficacy and Anxiety Questionnaire (MSEAQ) Scale overview: The Mathematics Self-Efficacy and Anxiety Questionnaire (MSEAQ) is a 29-item self-report measure of both mathematics self-efficacy and mathematics anxiety. Author: Diana Kathleen May Response Type: Items are rated on a 5-point Likert-type scale following a “no response” option: 1 = Never 2 = Seldom 3 = Sometimes 4 = Often 5 = usually Sample items 1. I feel confident enough to ask questions  in my mathematics class. 6. I worry that I will not be able to get a  good grade in my mathematics course.   Subscales and basic statistics for the MSEAQ       Self-Efficacy M = 44.11, SD = 10.78, alpha = .93       Anxiety M = 46.47, SD = 12.61, alpha = .93       Total Scale M = 90.58, SD = 22.78, alpha = .96 Reliability: See the Cronbach’s alpha levels reported above. Validity: There were significant positive correlations with similar measures. The results of a Fa