
Charting Police Shootings to death by Race and Year

The vertical bar chart is a useful method to show comparisons provided the data are accurate. The following chart presents data for three large major race groups in the US.


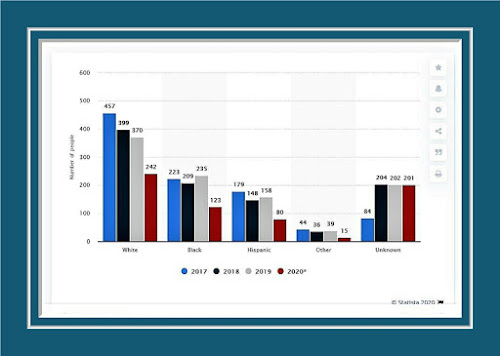
Chart from Statista for August 2020- 
See their page for current data, charts, and additional resources.


According to the US census, the estimated population of the US in 2019 was 328,239,523.
The estimated and rounded percentages of the major groups are:
  White 77%
  Black/ African American 13%
  Hispanic/Latino 18%

According to Statista.com, police shootings (to death) of Whites declined between 2017-2019, dropped then increased for Blacks, and for Hispanics.

Considering the small percentage of the population for Blacks and Hispanics, they fare worse than do Whites. See the statisca chart. Here's the link to the Statista chart.

Ad
Learn more about creating surveys, including calculating and reporting statistics in Creating Surveys on AMAZON    or   GOOGLE  Worldwide


Connections

My Page    www.suttong.com
  
My Books  AMAZON                       GOOGLE STORE

FACEBOOK   Geoff W. Sutton
TWITTER  @Geoff.W.Sutton

Publications (many free downloads)
 
Academia   Geoff W Sutton   (PhD)     

  ResearchGate   Geoffrey W Sutton   (PhD)


Comments

Popular posts from this blog

Personal Self-Concept Questionnaire (PSQ)

  The Personal Self-Concept Questionnaire  ( PSQ )   Overview The Personal Self-Concept Questionnaire (PSQ) measures self-concept based on ratings of 18 items, which are grouped into four categories: Self-fulfilment, autonomy, honesty, and emotional self-concept. Subscales : The PSQ has four subscales 1. Self-fulfilment (6 items) 2. Autonomy (4 items) 3. Honesty (3 items) 4. Emotional self-concept (5 items)  ðŸ‘‰ [ Read more about Self-Concept and Self-Identity] The PSQ is a Likert-type scale with five response options ranging from totally disagree to totally agree. Reliability and Validity In the first study, coefficient alpha = .85 and in study two, alpha = .83. Data analysis supported a four-dimensional model (see the four categories above). Positive correlations with other self-concept measures were statistically significant. Other notes The authors estimated it took about 10 minutes to complete the PSQ. Their first study included people ages 12 to 36 ( n = 506). In the second s

Student Self-Efficacy

  Assessment name:  STUDENT SELF-EFFICACY SCALE * Note. This post has been updated to provide an available measure of student self-efficacy. ———- Scale overview:  The  student self-efficacy scale i s a 10-item measure of self-efficacy. It was developed using data from university nursing students in the United States. Authors: Melodie Rowbotham and Gerdamarie Schmitz Response Type:  A four-choice rating scale as follows: 1 = not at all true 2 = hardly true 3 = moderately true 4 = exactly true   Self-efficacy is the perception that a person can act in a way to achieve a desired goal.  Scale items There are 10 items. Examples: I am confident in my ability to learn, even if I am having a bad day. If I try hard enough, I can obtain the academic goals I desire.   Psychometric properties The authors reported that their sample scores ranged from 25 to 40 with a scale mean of 34.23 ( SD  = 3.80. Internal consistency was high at alpha = .84. The authors reported the results of a principal compon

Mathematics Self-Efficacy and Anxiety Questionnaire (MSEAQ)

  Scale name: Mathematics Self-Efficacy and Anxiety Questionnaire (MSEAQ) Scale overview: The Mathematics Self-Efficacy and Anxiety Questionnaire (MSEAQ) is a 29-item self-report measure of both mathematics self-efficacy and mathematics anxiety. Author: Diana Kathleen May Response Type: Items are rated on a 5-point Likert-type scale following a “no response” option: 1 = Never 2 = Seldom 3 = Sometimes 4 = Often 5 = usually Sample items 1. I feel confident enough to ask questions  in my mathematics class. 6. I worry that I will not be able to get a  good grade in my mathematics course.   Subscales and basic statistics for the MSEAQ       Self-Efficacy M = 44.11, SD = 10.78, alpha = .93       Anxiety M = 46.47, SD = 12.61, alpha = .93       Total Scale M = 90.58, SD = 22.78, alpha = .96 Reliability: See the Cronbach’s alpha levels reported above. Validity: There were significant positive correlations with similar measures. The results of a Fa